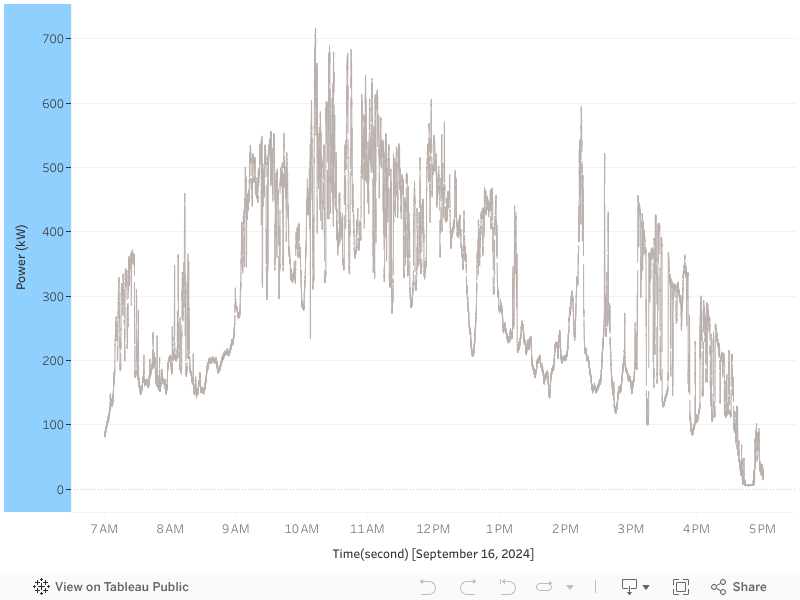
So this is the kind of power output you get from a solar power plant. Specifically, this one is recorded on a 1 MWp power plant located in Paris. Needless to say, intermittency and volatility of the curve is not exactly what European grid were built for. Let’s see what solar power control technology can do for us.
Solar power plant output
Wematics
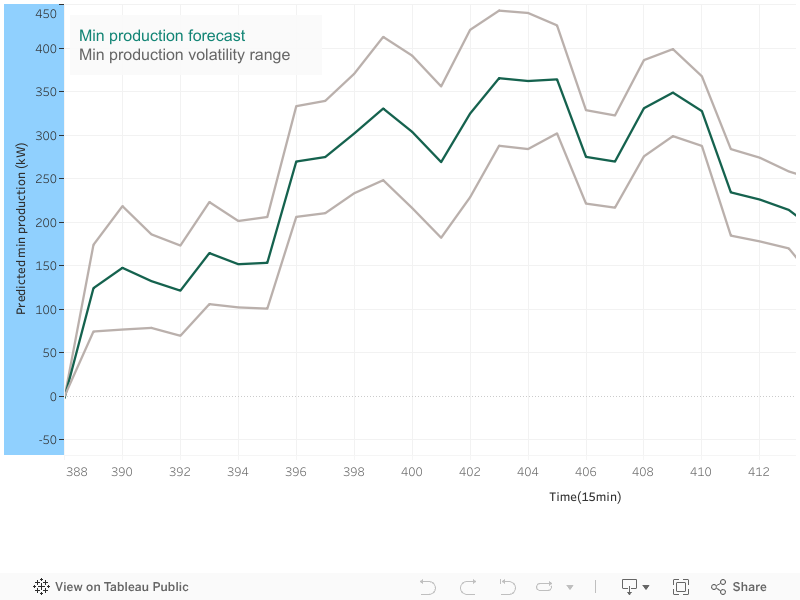
As mentioned in “The quest for accurate solar forecasting“, solar power prediction literature is evolving at fast pace. Applying latest techniques, we will start by forecasting minimum production value for every quarter for this power plant. Once we have our minimum production forecasts, we will further predict volatility (standard deviation) for the associated quarter. The idea here is that a minimum production value associated with a high volatility is less reliable than the one associated with very low volatility.
Forecasted minimum and standard deviation values for solar power plant power output
Epon Energy
The green line displays forecasted minimum production value within the quarter. The grey lines display predicted volatility. Typically, we will tend to predict lower standard deviations when power plant has been producing steady output in the previous quarters (clearer sky) and higher volatility when output has been bumpier.
Next step is to define a power control function that will define a steady reliable power output value we are confident the power plant can deliver. We will define this value based on previous forecasts and then curtail the inverters to deliver this exact value. Here there are several possible strategies. In the frame of this post, let’s consider a simple one:
Power control value = forecasted mean – safety margin
With safety margin = 1,5 * forecasted standard deviation
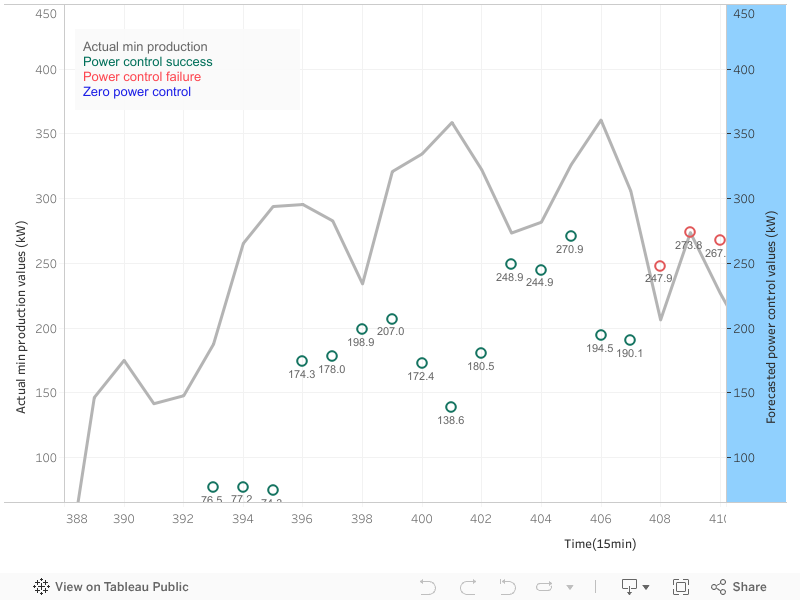
The next graph displays, for every quarter, the actual minimum production value (grey line) and the forecasted power control value (colour circles). The power control value is green if properly delivered and red if not. Blue circles mean that volatility has been considered too high to engage and power control value set to 0 (total curtailment of inverters)
Solar power control values
Epon Energy
In this case power control got it wrong 5 quarters in the day, meaning it engaged a value that was above the value the power plant could reliably provide during the quarter. In the other 29 quarters power control value was either delivered, either set to 0. Overall reliability is 81% (29/36).
The main interest of solar power control is it to transforms a volatile into a predictable and steady power output. The following illustrations compares initial power plant output with the power produced under active baselining technologies.
Unsupervised vs power control production
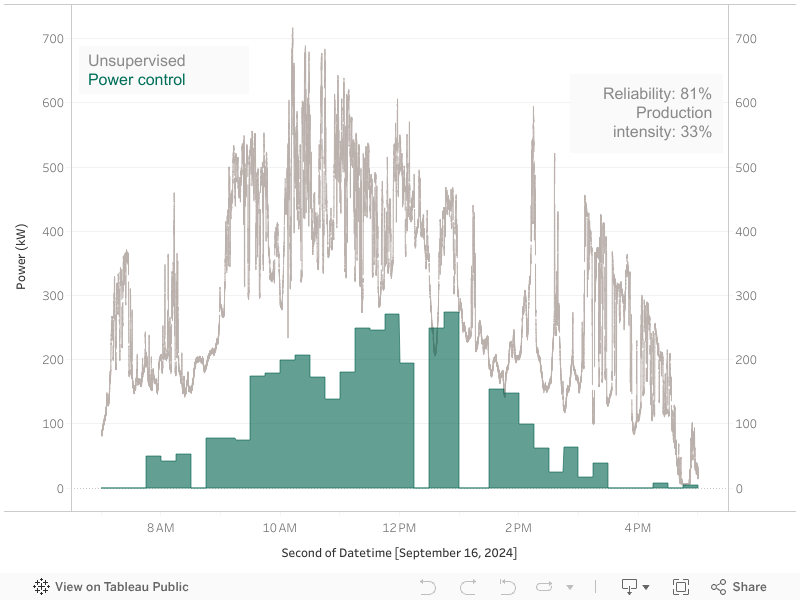
The downside is it significantly reduces the solar power plant production. In this case, on september 16, 2024 we went from 2.782 kWh to 929 kWh (33%).
The more conservative you get with safety coefficient, the higher your reliability and the lower you total production. Averaging solar power control results yearly, you will reach the following performances. Safety coefficient is the multiplier of the standard deviation in the previous formula.
| Safety coefficient | Reliability | Production intensity |
| 0,5 | 59,4% | 52% |
| 1 | 71,3% | 50% |
| 1,5 | 82,8% | 43% |
| 2 | 89,1% | 35% |
Epon Energy
Solar power control is likely to become increasingly useful in the coming years. Increasing solar power plant reliability will be key in the next stages of solar power development. So will our ability to pilot solar power output. As the cost of solar power plant is decreasing, production intensity will become less important than its ability to react to electrical grid constraints.
Further, solar power control opens the door to balancing markets for solar power plants, as they are requesting steady predictable sources of energy to balance the grid. “Balancing the grid with solar power” post will enter into the details of this strategy and quantify potential new revenues for solar power plants owners.